
Updated using 2025 PPP-per-person data and the World Bank’s 2026 governance-indicator release.
Prepared for Development and Resilience Research Monitor (DRRM).
Seychelles is the central lens for this illustrative governance-catch-up scenario: it starts 61st and is 67th in the central scenario, a relative drop of 6 places among the 189 ranked countries. Mauritius moves from 67th to 68th (Down 1), while Maldives moves from 73rd to 69th (Up 4). These are GDP-per-person PPP ranks—not total GDP or household income—and the outputs are illustrative model results, not forecasts. A relative rank drop does not mean baseline income falls; it can mean that other countries gain more.
In plain language, Seychelles remains a relatively prosperous small island state in this comparison, but it is overtaken in the modeled ordering as some countries receive larger governance-linked uplifts. Mauritius is nearly unchanged, while Maldives moves up. For small island developing states (SIDS), this is a useful global comparison of relative position, not a claim that geography, living standards or household circumstances suddenly change.
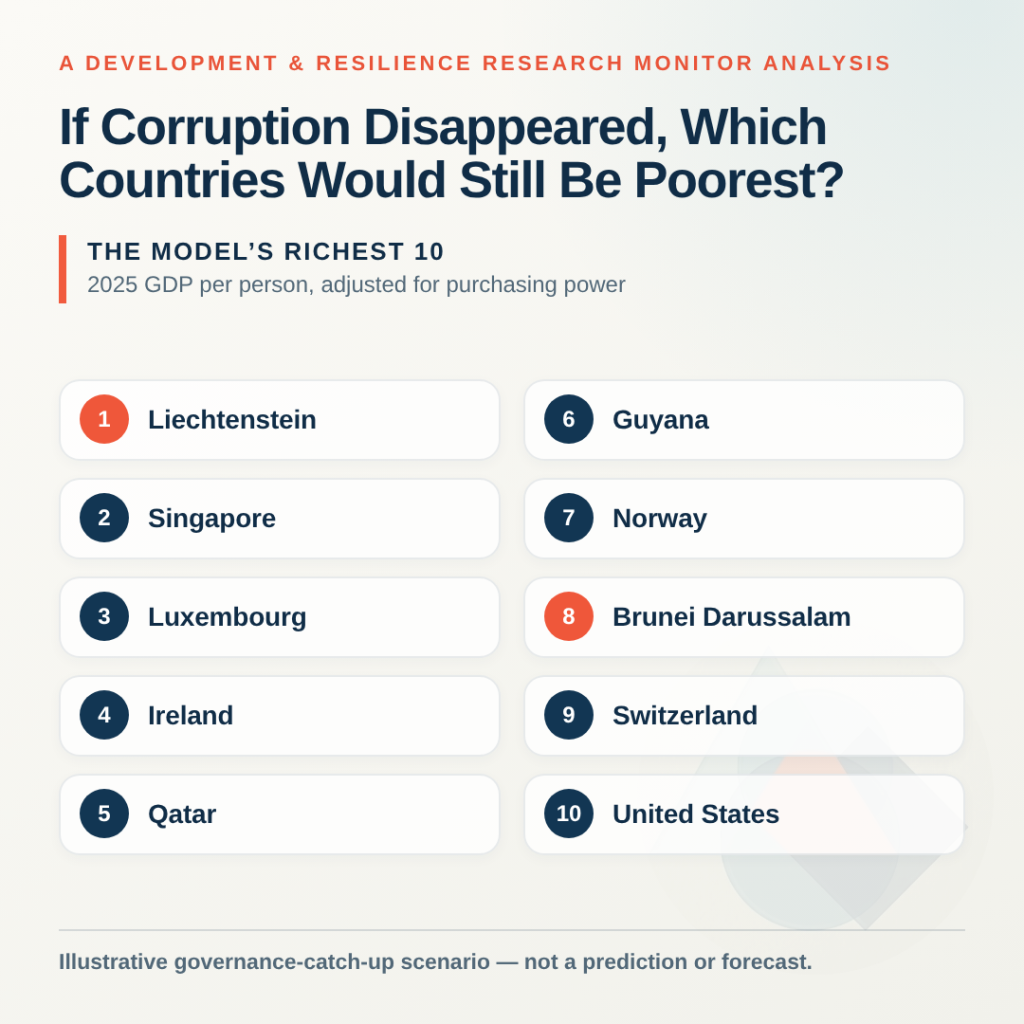
Among the 189 countries that can be ranked on comparable 2025 inputs, Burundi and the Central African Republic remain the two poorest in the scenario. South Sudan is third from the bottom. At the other end, Liechtenstein, Singapore and Luxembourg lead the scenario’s per-person ranking.
The biggest upward move is Russia, which rises 26 places, from 46th to 20th. Türkiye climbs 14 places. Turkmenistan and Libya rise 13 each. These are hypothetical rank changes, not predictions that those countries will earn a specific amount more.
The complete 195-country table lists each country’s baseline and scenario rank, movement, governance inputs, GDP source and resource-rent data. It also includes two alternate uplift assumptions. Six countries are marked unranked rather than assigned invented values.
The scenario’s richest and poorest
The model ranks GDP per person adjusted for purchasing power, not total national GDP. Its richest ten are Liechtenstein, Singapore, Luxembourg, Ireland, Qatar, Guyana, Norway, Brunei Darussalam, Switzerland and the United States. Guyana moves from eighth to sixth; the others change little. [3] [4] [5] [7]
The poorest ten in the scenario are Burundi (189th), the Central African Republic (188th), South Sudan (187th), Mozambique (186th), Malawi (185th), Yemen (184th), Somalia (183rd), Madagascar (182nd), Liberia (181st) and the Democratic Republic of the Congo (180th). The model lifts incomes for some countries, but it does not assume that better governance instantly erases conflict, infrastructure gaps, health burdens or other barriers to development.
The ranking is about average economic output per person measured using purchasing-power-parity (PPP) GDP per person. It is not total GDP and does not show household income, inequality, household wealth or how much of national income reaches ordinary people.
Which countries move most?
Ranks run from 1 (highest GDP per person) to 189 (lowest). A plus sign means moving toward the richer end of the table.
| Country | Current → scenario rank | Movement |
|---|---|---|
| Russia | 46 → 20 | +26 |
| Türkiye | 49 → 35 | +14 |
| Turkmenistan | 88 → 75 | +13 |
| Libya | 105 → 92 | +13 |
| Bahrain | 24 → 12 | +12 |
| Belarus | 64 → 52 | +12 |
| Kuwait | 38 → 27 | +11 |
| Iran | 96 → 85 | +11 |
| Venezuela | 133 → 122 | +11 |
| Equatorial Guinea | 107 → 97 | +10 |
Ten ranked countries rise at least ten places in the central scenario; twelve fall at least ten. The largest falls are New Zealand and Palau (13 places each), followed by the United Kingdom, Japan, Estonia, Barbados, Bhutan and Samoa (12 each). A country can fall in relative rank because others gain ground; the model does not reduce its baseline GDP.
Several of the upward movers have substantial resource sectors. The World Bank’s latest broad-coverage resource-rent data are for 2021: rents were about 34% of GDP in Guyana, 43% in Iraq and 61% in Libya. The measure includes oil, gas, coal, minerals and forest rents. It is not a tally of reserves or future potential. [16]
Those figures are context, not a bonus in the scenario formula. The model does not assume new discoveries or calculate the value of untapped reserves. Turning resource wealth into lasting public benefit depends on how governments award contracts, collect royalties and taxes, and invest the proceeds. [17]
How to read the “no corruption” scenario
The World Bank’s WGI 2026 estimates-and-scores file was updated on September 18, 2026 and covers 1996–2025. The release recalculates its historical estimates under a revised methodology. I use its 2025 estimates for Control of Corruption, Rule of Law and Government Effectiveness. [8] [9] [12] WGI draws on perception data from surveys and expert assessments. It measures broad governance conditions, not the number of corrupt transactions or a precise dollar cost of corruption. [9] [10]
For this thought experiment, I take an equal-weight average of those three standard-normal estimates. [10] [13] [14] [15] The 90th-percentile value of that average among the 189 rankable countries is 1.351. This is a modeling convenience, not an official WGI composite. The World Bank cautions that its dimensions should not be collapsed into one overall governance score. [11]
The central scenario multiplies baseline GDP per person by 1 + 0.25 × max(0, 1.351 − governance composite). In plain language, countries below the benchmark get a modeled 25% uplift per governance-estimate point of gap, pro-rated for fractions; those already above it receive no uplift. This assumption is not estimated from causal evidence. It is an illustrative way to turn a hypothetical into rank movements, not a prediction of what would happen in a corruption-free world.
The result depends strongly on that chosen uplift. At 15% per point, one country rises ten or more places and two fall that far. At 30%, fourteen rise ten or more and eighteen fall. The central assumption produces ten large upward movements and twelve large downward movements. The exact positions are therefore less dependable than the broad point that countries with weak governance and room for improvement may gain ground.
What the 2025 data can and cannot rank
The table covers the 193 UN member states plus the Holy See and the State of Palestine, the two non-member observer states. [1] [2] The World Bank’s 2025 GDP-per-person PPP series has values for 180 of these countries. I use same-year 2025 IMF WEO PPP-per-person values as a clearly labeled fallback for nine more: Afghanistan, the Bahamas, Lebanon, Liechtenstein, San Marino, South Sudan, the United Arab Emirates, Venezuela and Yemen. The State of Palestine has a World Bank value but no IMF value in this series. [3] [4] [5] [6] [7]
The two sources report PPP GDP per person in current international dollars, but their estimates are not identical. The table marks each country’s GDP source so IMF fallbacks are visible. The WGI 2026 release has 2025 estimates for 194 of the 195 countries in this table; the Holy See has no WGI estimates in the series. [8]
Six countries still have no comparable 2025 PPP figure in either selected GDP source: Cuba, Eritrea, the Holy See, Monaco, North Korea and Syria. Eritrea’s latest IMF PPP-per-person observation is from 2019; Syria’s latest World Bank observation is from 2022. These older values appear as context in the table but do not determine a 2025 rank. The IMF says it does not monitor Cuba or North Korea because they are not IMF members. The selected datasets do not provide a comparable 2025 PPP series for Monaco or the Holy See. [3] [7] [18]
For the Holy See, the gap is broader: it also has no WGI estimate for 2025. For the other five, WGI estimates are present, but without a comparable 2025 PPP-per-person baseline there is no honest rank movement to calculate. “Unranked” is more accurate than borrowing a neighboring country’s value or mixing years.
Complete country ranking table
Rank 1 is the highest PPP GDP per person in the table; larger rank numbers are farther toward the poorest end. “Places up/down” compares the baseline rank with the central scenario rank (scenario_rank_p25).
| Country | Baseline rank | Central scenario rank | Places up/down |
|---|---|---|---|
| Liechtenstein | 1 | 1 | No change |
| Singapore | 2 | 2 | No change |
| Luxembourg | 3 | 3 | No change |
| Ireland | 4 | 4 | No change |
| Qatar | 5 | 5 | No change |
| Guyana | 8 | 6 | Up 2 |
| Norway | 6 | 7 | Down 1 |
| Brunei Darussalam | 9 | 8 | Up 1 |
| Switzerland | 7 | 9 | Down 2 |
| United States | 10 | 10 | No change |
| United Arab Emirates | 12 | 11 | Up 1 |
| Bahrain | 24 | 12 | Up 12 |
| San Marino | 13 | 13 | No change |
| Saudi Arabia | 20 | 14 | Up 6 |
| Netherlands | 11 | 15 | Down 4 |
| Malta | 22 | 16 | Up 6 |
| Iceland | 14 | 17 | Down 3 |
| Denmark | 15 | 18 | Down 3 |
| Andorra | 16 | 19 | Down 3 |
| Russia | 46 | 20 | Up 26 |
| Austria | 17 | 21 | Down 4 |
| Germany | 18 | 22 | Down 4 |
| Belgium | 19 | 23 | Down 4 |
| Cyprus | 28 | 24 | Up 4 |
| Italy | 31 | 25 | Up 6 |
| Sweden | 21 | 26 | Down 5 |
| Kuwait | 38 | 27 | Up 11 |
| Australia | 23 | 28 | Down 5 |
| France | 29 | 29 | No change |
| Spain | 33 | 30 | Up 3 |
| Canada | 25 | 31 | Down 6 |
| Slovenia | 35 | 32 | Up 3 |
| Finland | 26 | 33 | Down 7 |
| Israel | 34 | 34 | No change |
| Türkiye | 49 | 35 | Up 14 |
| South Korea | 30 | 36 | Down 6 |
| Romania | 44 | 37 | Up 7 |
| Czechia | 32 | 38 | Down 6 |
| United Kingdom | 27 | 39 | Down 12 |
| Hungary | 45 | 40 | Up 5 |
| Poland | 40 | 41 | Down 1 |
| Croatia | 43 | 42 | Up 1 |
| Slovakia | 47 | 43 | Up 4 |
| Kazakhstan | 53 | 44 | Up 9 |
| Panama | 54 | 45 | Up 9 |
| Bulgaria | 52 | 46 | Up 6 |
| Lithuania | 37 | 47 | Down 10 |
| Portugal | 41 | 48 | Down 7 |
| New Zealand | 36 | 49 | Down 13 |
| Greece | 50 | 50 | No change |
| Japan | 39 | 51 | Down 12 |
| Belarus | 64 | 52 | Up 12 |
| Bahamas | 51 | 53 | Down 2 |
| Estonia | 42 | 54 | Down 12 |
| Oman | 55 | 55 | No change |
| Latvia | 48 | 56 | Down 8 |
| Trinidad and Tobago | 59 | 57 | Up 2 |
| Malaysia | 56 | 58 | Down 2 |
| Serbia | 65 | 59 | Up 6 |
| Montenegro | 63 | 60 | Up 3 |
| St. Kitts and Nevis | 60 | 61 | Down 1 |
| Argentina | 68 | 62 | Up 6 |
| Antigua and Barbuda | 62 | 63 | Down 1 |
| Chile | 58 | 64 | Down 6 |
| Uruguay | 57 | 65 | Down 8 |
| Costa Rica | 66 | 66 | No change |
| Seychelles | 61 | 67 | Down 6 |
| Mauritius | 67 | 68 | Down 1 |
| Maldives | 73 | 69 | Up 4 |
| Mexico | 79 | 70 | Up 9 |
| Georgia | 69 | 71 | Down 2 |
| Dominican Republic | 71 | 72 | Down 1 |
| China | 70 | 73 | Down 3 |
| North Macedonia | 75 | 74 | Up 1 |
| Turkmenistan | 88 | 75 | Up 13 |
| Albania | 74 | 76 | Down 2 |
| Azerbaijan | 77 | 77 | No change |
| Bosnia and Herzegovina | 80 | 78 | Up 2 |
| Thailand | 76 | 79 | Down 3 |
| St. Lucia | 72 | 80 | Down 8 |
| Gabon | 89 | 81 | Up 8 |
| Armenia | 81 | 82 | Down 1 |
| Brazil | 82 | 83 | Down 1 |
| Colombia | 87 | 84 | Up 3 |
| Iran | 96 | 85 | Up 11 |
| Suriname | 86 | 86 | No change |
| Paraguay | 94 | 87 | Up 7 |
| Egypt | 93 | 88 | Up 5 |
| Mongolia | 91 | 89 | Up 2 |
| Barbados | 78 | 90 | Down 12 |
| Ukraine | 98 | 91 | Up 7 |
| Libya | 105 | 92 | Up 13 |
| Dominica | 85 | 93 | Down 8 |
| Peru | 99 | 94 | Up 5 |
| St. Vincent and the Grenadines | 84 | 95 | Down 11 |
| Palau | 83 | 96 | Down 13 |
| Equatorial Guinea | 107 | 97 | Up 10 |
| Moldova | 95 | 98 | Down 3 |
| Algeria | 100 | 99 | Up 1 |
| Grenada | 90 | 100 | Down 10 |
| Botswana | 92 | 101 | Down 9 |
| Ecuador | 104 | 102 | Up 2 |
| Indonesia | 102 | 103 | Down 1 |
| Vietnam | 101 | 104 | Down 3 |
| Guatemala | 110 | 105 | Up 5 |
| Sri Lanka | 103 | 106 | Down 3 |
| Iraq | 112 | 107 | Up 5 |
| Tunisia | 109 | 108 | Up 1 |
| Bhutan | 97 | 109 | Down 12 |
| South Africa | 108 | 110 | Down 2 |
| Belize | 111 | 111 | No change |
| El Salvador | 114 | 112 | Up 2 |
| Bolivia | 117 | 113 | Up 4 |
| Uzbekistan | 115 | 114 | Up 1 |
| Fiji | 106 | 115 | Down 9 |
| Lebanon | 123 | 116 | Up 7 |
| Eswatini | 120 | 117 | Up 3 |
| Nauru | 113 | 118 | Down 5 |
| Philippines | 119 | 119 | No change |
| Jamaica | 116 | 120 | Down 4 |
| Jordan | 118 | 121 | Down 3 |
| Venezuela | 133 | 122 | Up 11 |
| Angola | 127 | 123 | Up 4 |
| Laos | 126 | 124 | Up 2 |
| India | 124 | 125 | Down 1 |
| Bangladesh | 128 | 126 | Up 2 |
| Morocco | 125 | 127 | Down 2 |
| Namibia | 122 | 128 | Down 6 |
| Nicaragua | 131 | 129 | Up 2 |
| Nigeria | 129 | 130 | Down 1 |
| Kyrgyzstan | 132 | 131 | Up 1 |
| Cabo Verde | 121 | 132 | Down 11 |
| Cambodia | 137 | 133 | Up 4 |
| Djibouti | 138 | 134 | Up 4 |
| Honduras | 140 | 135 | Up 5 |
| Republic of the Congo | 142 | 136 | Up 6 |
| Mauritania | 141 | 137 | Up 4 |
| Côte d’Ivoire | 139 | 138 | Up 1 |
| Ghana | 136 | 139 | Down 3 |
| Tonga | 135 | 140 | Down 5 |
| Marshall Islands | 134 | 141 | Down 7 |
| Samoa | 130 | 142 | Down 12 |
| Zimbabwe | 146 | 143 | Up 3 |
| Myanmar | 149 | 144 | Up 5 |
| Pakistan | 145 | 145 | No change |
| Kenya | 143 | 146 | Down 3 |
| Tajikistan | 150 | 147 | Up 3 |
| Cameroon | 151 | 148 | Up 3 |
| Nepal | 148 | 149 | Down 1 |
| Sao Tome and Principe | 147 | 150 | Down 3 |
| Tuvalu | 144 | 151 | Down 7 |
| Guinea | 155 | 152 | Up 3 |
| State of Palestine | 154 | 153 | Up 1 |
| Papua New Guinea | 153 | 154 | Down 1 |
| Senegal | 152 | 155 | Down 3 |
| Timor-Leste | 157 | 156 | Up 1 |
| Benin | 156 | 157 | Down 1 |
| Comoros | 162 | 158 | Up 4 |
| Tanzania | 160 | 159 | Up 1 |
| Zambia | 161 | 160 | Up 1 |
| Vanuatu | 159 | 161 | Down 2 |
| Togo | 164 | 162 | Up 2 |
| Sierra Leone | 166 | 163 | Up 3 |
| Mali | 169 | 164 | Up 5 |
| Micronesia | 158 | 165 | Down 7 |
| Haiti | 173 | 166 | Up 7 |
| Guinea-Bissau | 171 | 167 | Up 4 |
| Ethiopia | 168 | 168 | No change |
| Gambia | 167 | 169 | Down 2 |
| Uganda | 170 | 170 | No change |
| Rwanda | 163 | 171 | Down 8 |
| Kiribati | 165 | 172 | Down 7 |
| Chad | 175 | 173 | Up 2 |
| Lesotho | 172 | 174 | Down 2 |
| Burkina Faso | 174 | 175 | Down 1 |
| Afghanistan | 177 | 176 | Up 1 |
| Solomon Islands | 176 | 177 | Down 1 |
| Sudan | 178 | 178 | No change |
| Niger | 179 | 179 | No change |
| Democratic Republic of the Congo | 182 | 180 | Up 2 |
| Liberia | 180 | 181 | Down 1 |
| Madagascar | 181 | 182 | Down 1 |
| Somalia | 185 | 183 | Up 2 |
| Yemen | 186 | 184 | Up 2 |
| Malawi | 183 | 185 | Down 2 |
| Mozambique | 184 | 186 | Down 2 |
| South Sudan | 187 | 187 | No change |
| Central African Republic | 188 | 188 | No change |
| Burundi | 189 | 189 | No change |
| Cuba | Unranked | Unranked | Not applicable |
| Eritrea | Unranked | Unranked | Not applicable |
| Holy See | Unranked | Unranked | Not applicable |
| Monaco | Unranked | Unranked | Not applicable |
| North Korea | Unranked | Unranked | Not applicable |
| Syria | Unranked | Unranked | Not applicable |
References
- Member States, United Nations
- Non-Member Observer States, United Nations
- GDP per capita, PPP (current international $), World Bank Data
- World Bank GDP per capita PPP data, 2025 API
- GDP per capita, PPP, IMF World Economic Outlook DataMapper
- IMF DataMapper API documentation
- IMF DataMapper PPP-per-capita series
- WGI 2026: Governance Estimates and Scores (1996–2025), World Bank Data Catalog
- Worldwide Governance Indicators, World Bank
- Worldwide Governance Indicators documentation, World Bank
- WGI frequently asked questions, World Bank
- Revised Methodology for Measuring Governance Using Perception Data, World Bank
- Control of Corruption estimates, WGI 2025 data, World Bank API
- Rule of Law estimates, WGI 2025 data, World Bank API
- Government Effectiveness estimates, WGI 2025 data, World Bank API
- Total natural resources rents (% of GDP), World Bank DataBank
- Rents to Riches? The Political Economy of Natural Resource-Led Development, World Bank
- Country Composition of WEO Groups, IMF